Account Schedule Comparison Period Formula not working on 365 Business Central
onethreeone
Member Posts: 7
Hi There
I'm having a very frustrating time with account schedules. I designed a column layout for my client in NAV 2018 which worked fine. It showed them the figures for the stated date range, the figures for the same period LY, Current YTD and LYTD.
Having been upgraded by our partner to GB NAV 14.1 connected to Dynamics 365 Business Central the formulas for the Last Year columns are no longer working.
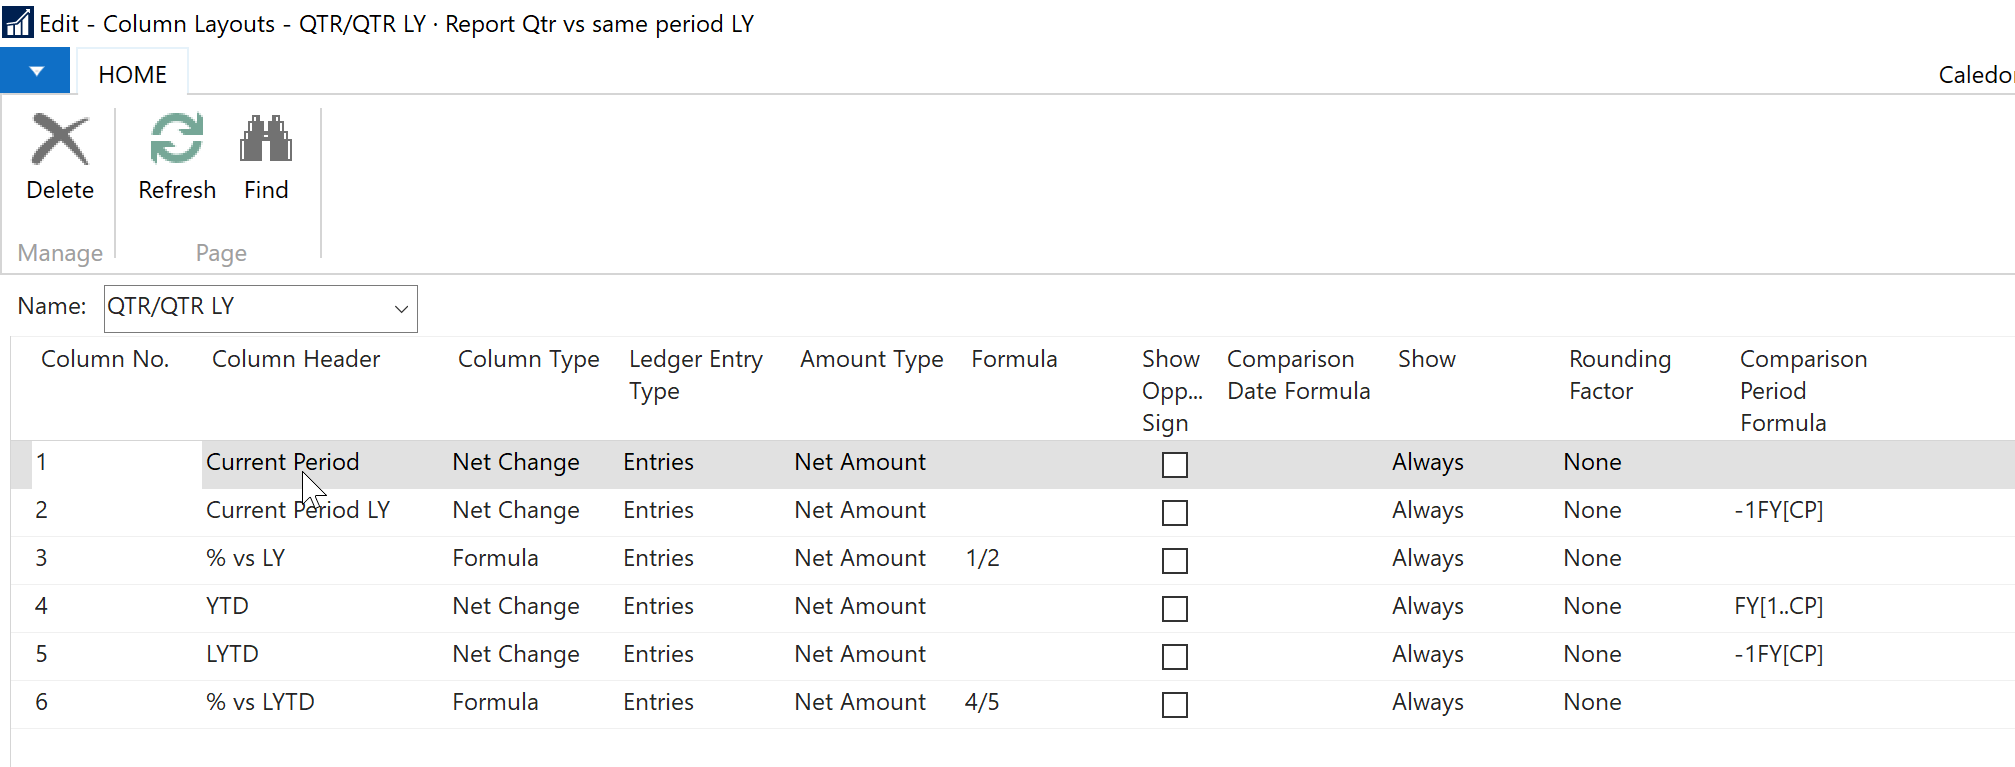
The colunm layout setup looks like this:

The client runs accounting periods on the 4-4-5 model so I have to use Comparison Period Formulas.
Previously, if I ran an Income Statement for P1..P9 (29/10/18..28/07/19) I would get,
Since the upgrade I now get the following date rages by column (bear in mind, I've made no changes to the formula)
I've tried every variant of the formula to get last year's figures for the equivalent period that I can imagine or can find suggested online
I've also tried changing the Column Type to Balance, Net Change or Balance at date. Nothing makes a difference.
Is this a bug in 365 Business Central or am I missing something embarrassingly obvious?
I'm having a very frustrating time with account schedules. I designed a column layout for my client in NAV 2018 which worked fine. It showed them the figures for the stated date range, the figures for the same period LY, Current YTD and LYTD.
Having been upgraded by our partner to GB NAV 14.1 connected to Dynamics 365 Business Central the formulas for the Last Year columns are no longer working.
The colunm layout setup looks like this:

The client runs accounting periods on the 4-4-5 model so I have to use Comparison Period Formulas.
Previously, if I ran an Income Statement for P1..P9 (29/10/18..28/07/19) I would get,
- in column 1, figures for that date range;
- in column 2 figures for 30/10/17..29/07/18;
- and in columns 4 & 5 the same (let's draw a veil over why the client wants YTD columns that show the same information...I thought they'd be reporting quarters separately each time, but no!)
Since the upgrade I now get the following date rages by column (bear in mind, I've made no changes to the formula)
- in column 1 no change: figures for the asked for date range are shown
- in column 2: 30/10/17..26/11/17. In other words P1 of the previous year
- in column 4 figures for the asked for date range as you'd expect
- and in column 5 30/10/17..26/11/17. In other words P1 of the previous year
I've tried every variant of the formula to get last year's figures for the equivalent period that I can imagine or can find suggested online
- -1FY
- -1FY[1..CP]
- -1FY[CP]
I've also tried changing the Column Type to Balance, Net Change or Balance at date. Nothing makes a difference.
Is this a bug in 365 Business Central or am I missing something embarrassingly obvious?
0
Best Answer
-
I’ve solved this myself (with help from a friend). What was causing the comparison period formula to fail was the fact that I was using a date range of P1..P9 on the account schedule rather than a single period (ie P9). This then returns the cumulative figures I’m after in columns 4 & 5.
*facepalm*0
Answers
-
I’ve solved this myself (with help from a friend). What was causing the comparison period formula to fail was the fact that I was using a date range of P1..P9 on the account schedule rather than a single period (ie P9). This then returns the cumulative figures I’m after in columns 4 & 5.
*facepalm*0
Categories
- All Categories
- 73 General
- 73 Announcements
- 66.7K Microsoft Dynamics NAV
- 18.8K NAV Three Tier
- 38.4K NAV/Navision Classic Client
- 3.6K Navision Attain
- 2.4K Navision Financials
- 116 Navision DOS
- 851 Navision e-Commerce
- 1K NAV Tips & Tricks
- 772 NAV Dutch speaking only
- 617 NAV Courses, Exams & Certification
- 2K Microsoft Dynamics-Other
- 1.5K Dynamics AX
- 330 Dynamics CRM
- 111 Dynamics GP
- 10 Dynamics SL
- 1.5K Other
- 990 SQL General
- 383 SQL Performance
- 34 SQL Tips & Tricks
- 35 Design Patterns (General & Best Practices)
- 1 Architectural Patterns
- 10 Design Patterns
- 5 Implementation Patterns
- 53 3rd Party Products, Services & Events
- 1.6K General
- 1.1K General Chat
- 1.6K Website
- 83 Testing
- 1.2K Download section
- 23 How Tos section
- 252 Feedback
- 12 NAV TechDays 2013 Sessions
- 13 NAV TechDays 2012 Sessions