NAV 2013 debugger - SQL Tracing
ACAE
Member Posts: 52
Hello,
Can somebody explain me how to use the SQL tracing in the new NAV 2013 debugger ? I know the SQL Server profiler, and I can debug in NAV 2013, but I can't link both together.
Does NAV save a file when I use SQL tracing in the debugger that I can open in the profiler ?
If I start the profiler it traces all (selected) events on the server, not only those of my session. This is done without the actions in the session list.
What I would like to get is a trace of all SQL statements that are done in a certain procedure, e.g. sales post, like what used to be possible in the client monitor.
Thx,
Andy
0
Comments
-
Have you read this post: Example of How to use SQL Tracing Feature to Profile AL Code?0
-
This is exactly what I'm looking for. Thank you very much.
Andy0 -
In the attached link you find a section:
"Configuring SQL Profiler
The important part here is to select appropriate events. In this case we are interested in seeing SQL statements’ text. To achieve that we need to enable SP:StmtCompleted and SQL:BatchCompleted events."
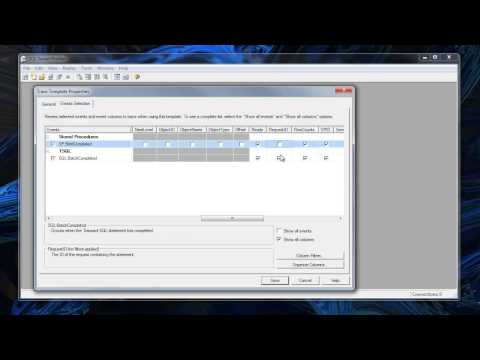
Can anybody tell me where I can set these properties (Trace Template Properties) ?
I don't find it anywhere.
Thanks in advance,
Blue0 -
Pardaan posted this document from the Microsoft Training material. Check out Lab 8.3
http://www.pardaan.com/wp-content/uploads/downloads/2010/04/NAV 2009 - Optimization and Troubleshooting.pdf0 -
I have a video on creating a SQL Profiler template on my YouTube channel -
 https://youtu.be/iGKG9ijE_ks
I have not looked whether it still works the same. It's done in older versions of NAV and SQL Server, but I'm sure the concept is still the same.1
Categories
- All Categories
- 75 General
- 75 Announcements
- 66.7K Microsoft Dynamics NAV
- 18.8K NAV Three Tier
- 38.4K NAV/Navision Classic Client
- 3.6K Navision Attain
- 2.4K Navision Financials
- 116 Navision DOS
- 851 Navision e-Commerce
- 1K NAV Tips & Tricks
- 772 NAV Dutch speaking only
- 610 NAV Courses, Exams & Certification
- 1.9K Microsoft Dynamics-Other
- 1.5K Dynamics AX
- 250 Dynamics CRM
- 102 Dynamics GP
- 6 Dynamics SL
- 1.5K Other
- 991 SQL General
- 383 SQL Performance
- 34 SQL Tips & Tricks
- 28 Design Patterns (General & Best Practices)
- Architectural Patterns
- 9 Design Patterns
- 4 Implementation Patterns
- 53 3rd Party Products, Services & Events
- 1.6K General
- 1K General Chat
- 1.6K Website
- 77 Testing
- 1.2K Download section
- 23 How Tos section
- 249 Feedback
- 12 NAV TechDays 2013 Sessions
- 13 NAV TechDays 2012 Sessions

